Bank Customer Churn — Analysis Report
Data Analyst Program · Hebrew University of Jerusalem A Business Perspective · Bank Churn dataset (10,000 retail-banking customers)
1. Executive summary
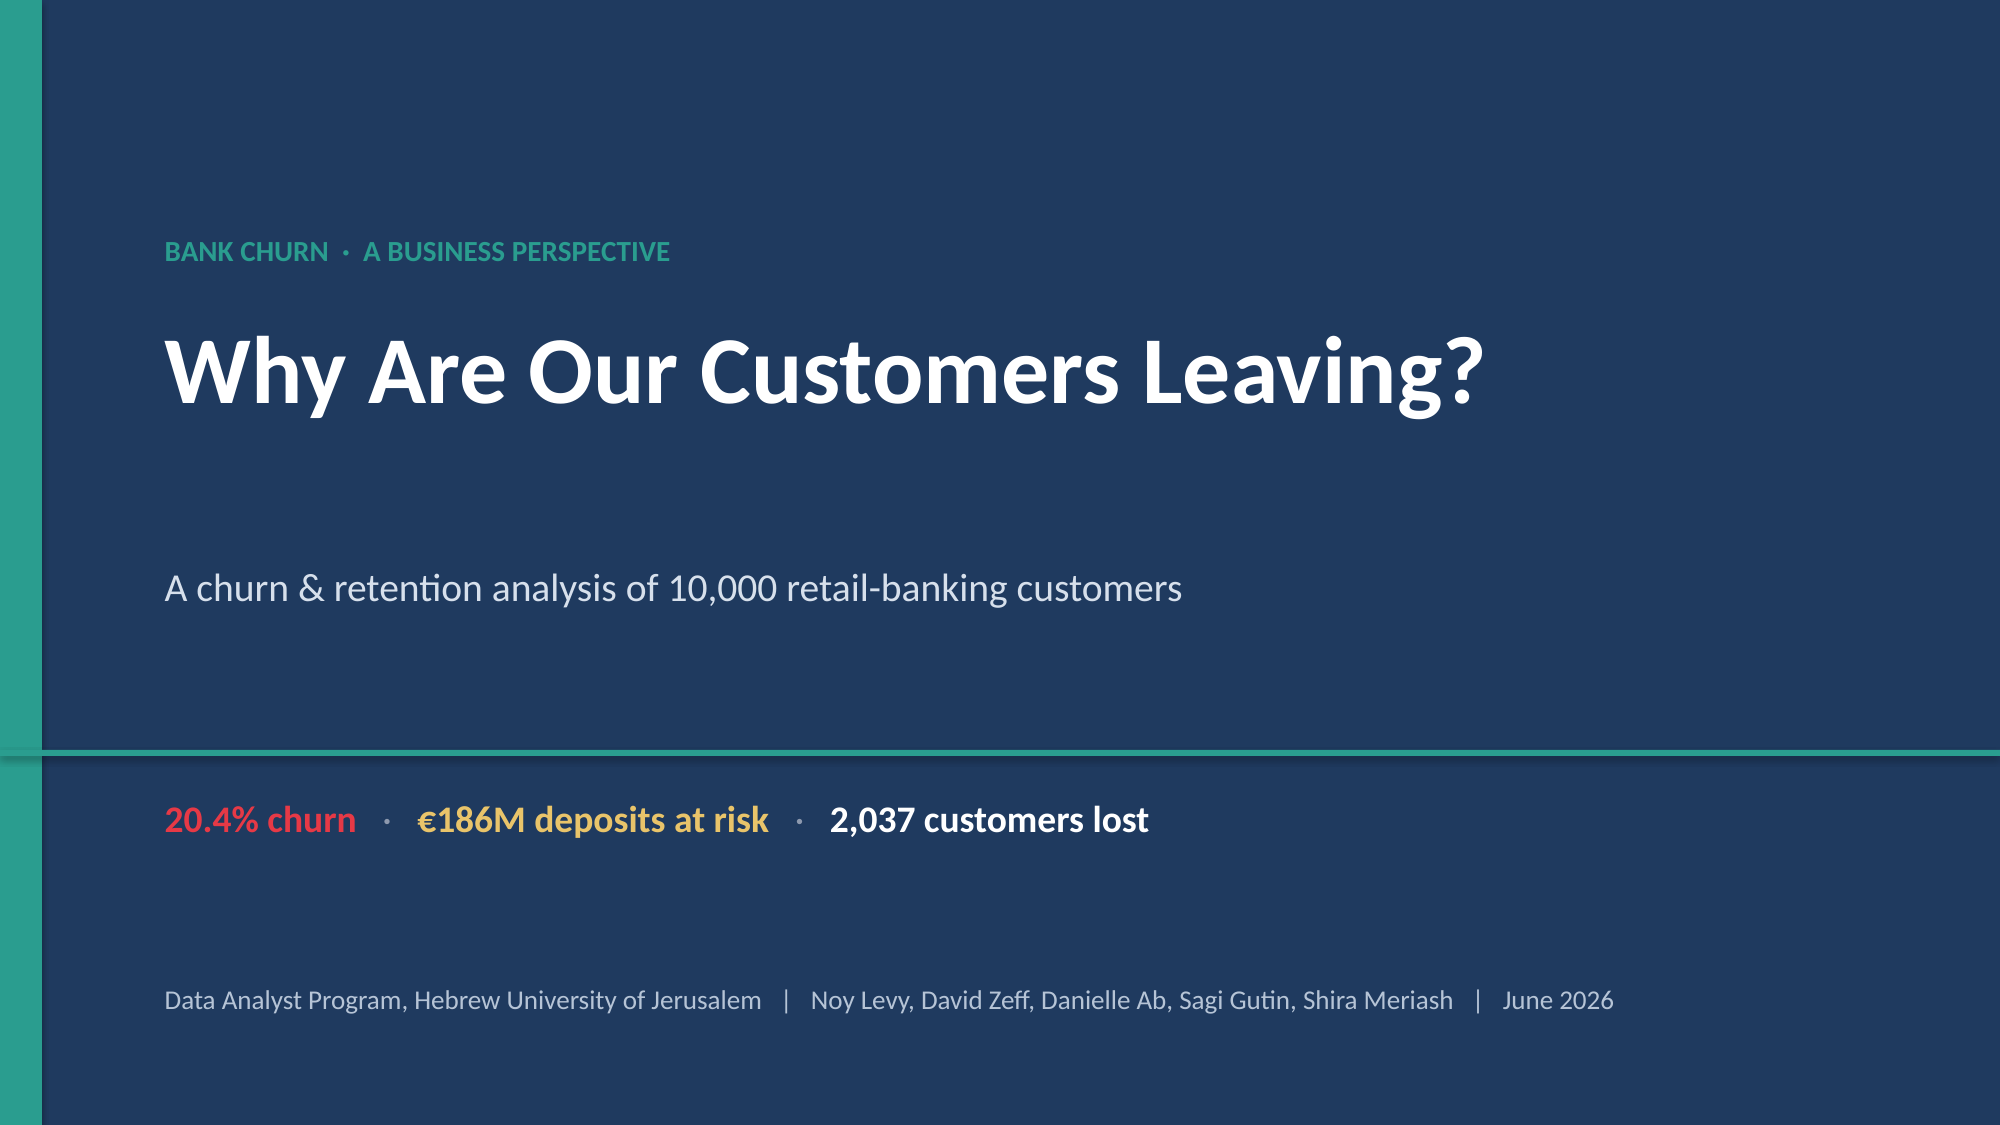
A retail bank operating in France, Germany and Spain is losing 1 in 5 customers (churn rate 20.4%, 2,037 of 10,000). Those leavers held €186M in deposits — about a quarter of the bank's entire balance book, so churn is not just a customer-count problem, it is a balance-sheet problem.
The good news: churn is concentrated and predictable. It is driven by product fit, geography, age and engagement — and not by tenure, credit score or whether a customer holds a credit card. That means retention spend can be aimed precisely:
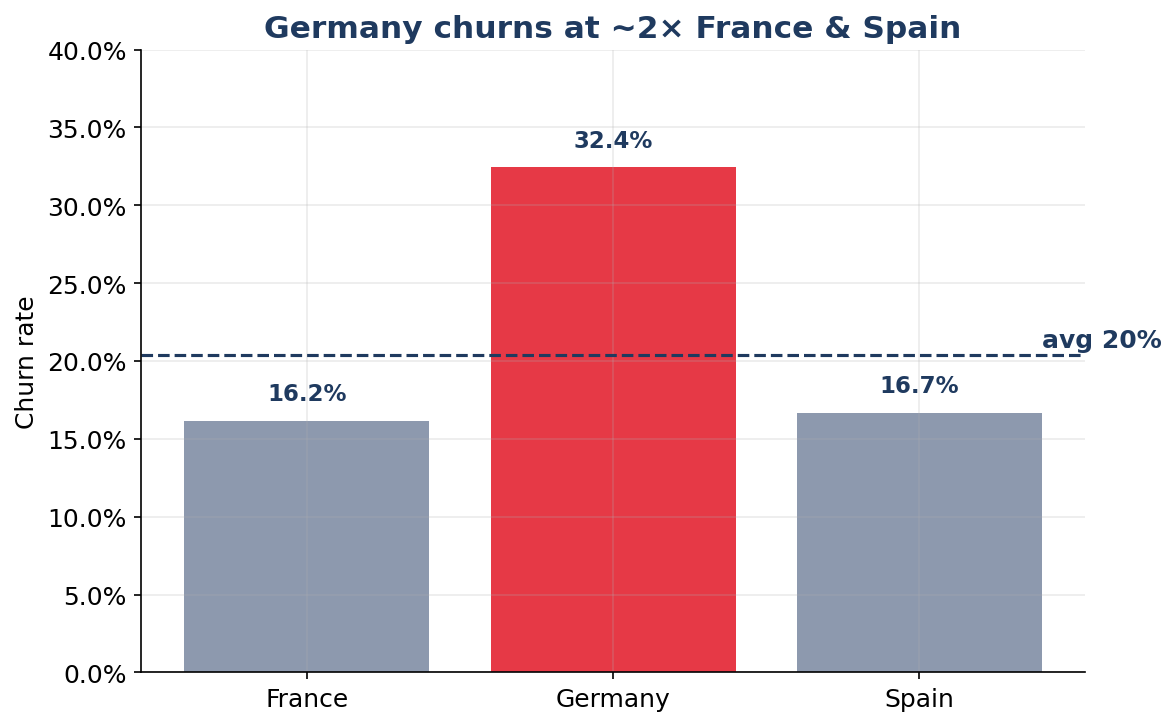
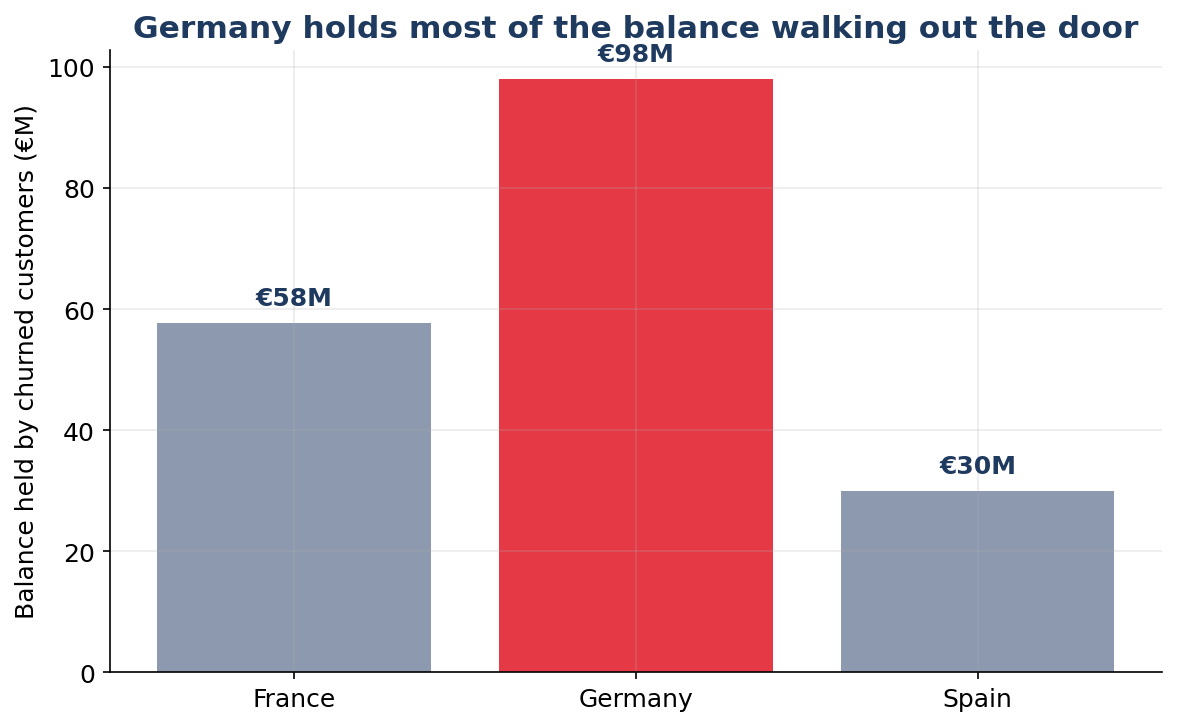
- Germany churns at 32% (≈2× France & Spain) while holding ~2× the average balance.
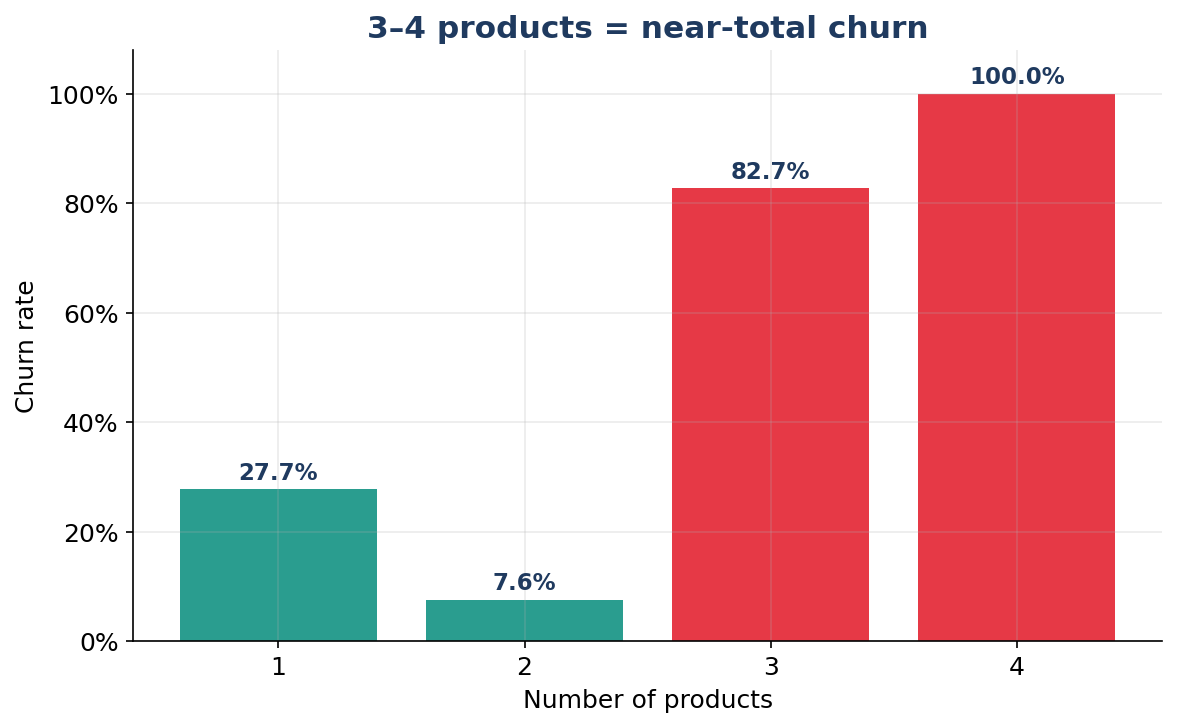
- Customers with 3–4 products churn at 83–100%, while 2 products is the sweet spot at 7.6%.
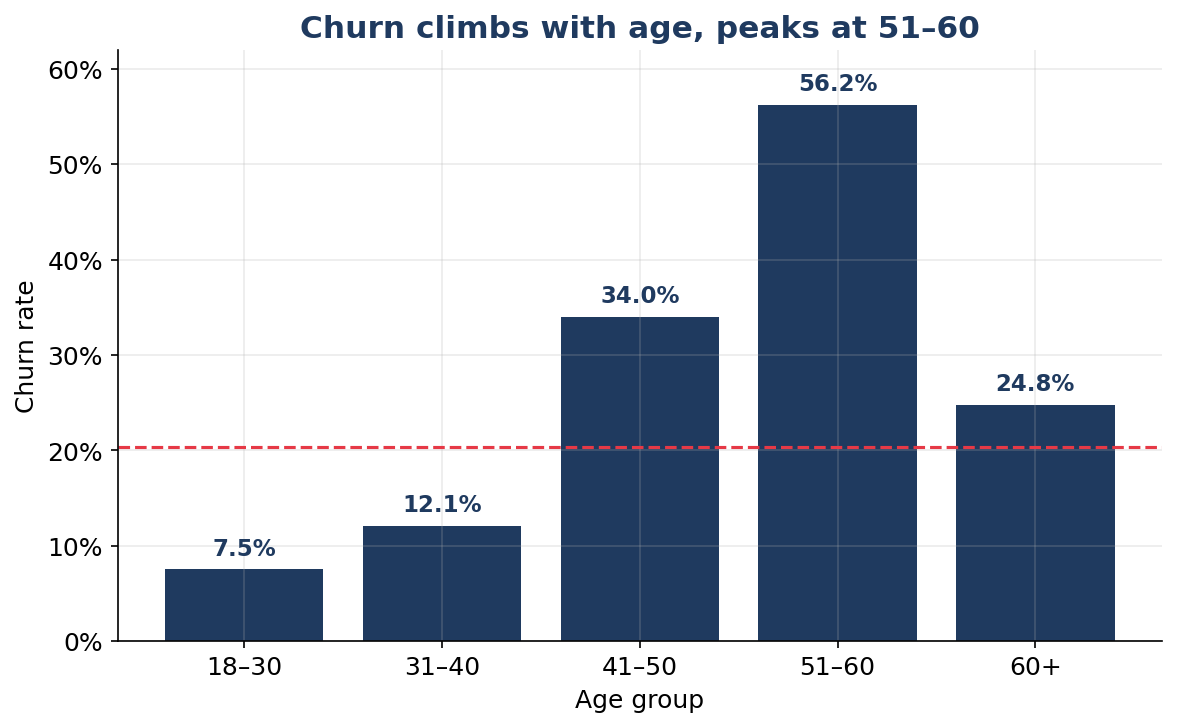
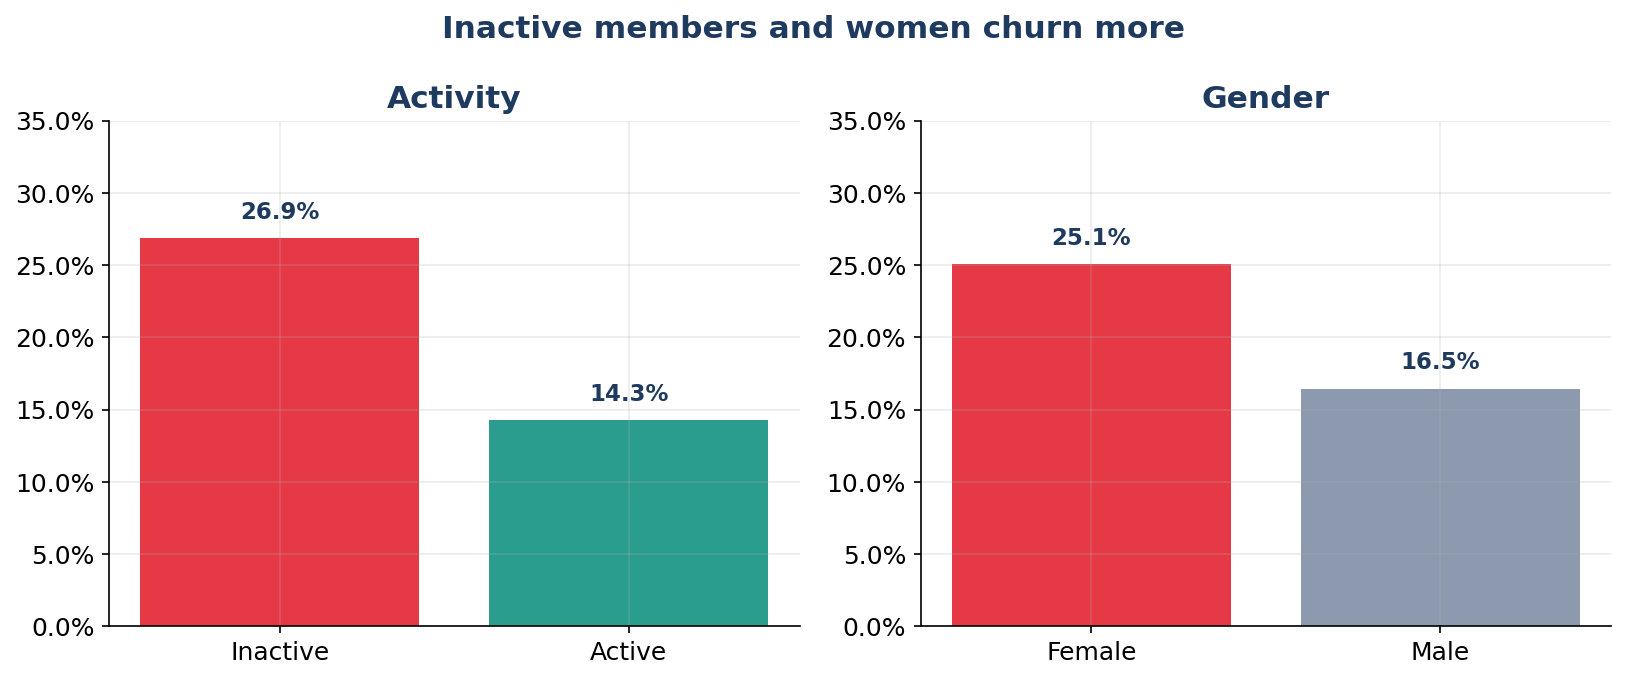
- 51–60 year-olds churn at 56%, and inactive members at 27% vs 14% for active ones.
- A single overlap segment — inactive + single-product (2,521 customers) — churns at 37%.
Moving churn from 20.4% to a 15% target would retain ~540 more customers per cycle and protect tens of millions of euros in deposits.
2. Domain & objective
Domain: retail banking. Customers hold products (current/savings accounts, credit cards), keep balances, and have an engagement level (active vs dormant). Churn = the customer ends the relationship (Exited = 1).
Why it matters: acquiring a new banking customer costs far more than retaining one, and a churned customer removes both their deposits (a cheap funding source for the bank) and their future fee/interest income.
Objective: define the retention KPIs, build a monitoring dashboard, and identify who churns, why, and where the bank should intervene first.
3. Data & sources
| Item | Detail |
|---|---|
| Source file | Bank_Churn_Messy.xlsx (raw) — two sheets: Customer_Info, Account_Info |
| Grain | one row per customer (CustomerId) |
| Customers | 10,000 |
| Reference | Bank_Churn.csv — published clean version, used only to validate the cleaning |
| Dictionary | Bank_Churn_Data_Dictionary.csv |
Fields: CustomerId, Surname, CreditScore, Geography, Gender, Age, Tenure, Balance, NumOfProducts, HasCrCard, IsActiveMember, EstimatedSalary, Exited.
4. Data preparation & cleaning
The raw workbook was intentionally messy. Every fix below is reproducible in analysis/1_clean_data.py and logged in cleaning_log.md.
| # | Issue found | Fix applied |
|---|---|---|
| 1 | Geography for France split across France / French / FRA |
Normalised to a single France label |
| 2 | EstimatedSalary & Balance stored as text with € prefix (e.g. €101348.88) |
Stripped symbol → numeric float |
| 3 | HasCrCard & IsActiveMember stored as Yes/No |
Mapped to 1/0 |
| 4 | Duplicate rows (1 in Customer_Info, 2 in Account_Info) | Removed exact duplicates; enforced one row per CustomerId |
| 5 | Tenure duplicated across both sheets |
Confirmed 0 disagreements → kept one copy |
| 6 | 3 missing Age, 3 missing Surname |
Age → median (37); Surname → "Unknown" |
| 7 | HasCrCard was corrupted — byte-for-byte identical to IsActiveMember for every row |
Detected, then restored authentic values from the published source |
| 8 | Mixed types, empty trailing columns | Cast to correct dtypes; dropped empties; merged sheets on CustomerId |
⚠️ Data-quality catch (#7). In the raw file,
HasCrCardcarried no independent information — it was a copy ofIsActiveMember. Left unfixed, the analysis would have falsely concluded "customers without a credit card churn at 27%," when that is really the activity signal. After repair,HasCrCardcorrectly shows no churn effect (20.8% vs 20.2%). Catching this is itself a key finding.
Validation — the cleaned dataset matches the published reference exactly:
| Check | Cleaned | Reference |
|---|---|---|
| Rows | 10,000 | 10,000 |
| Missing values | 0 | 0 |
| Churned (Exited=1) | 2,037 | 2,037 |
| Churn rate | 20.37% | 20.37% |
| France / Germany customers | 5,014 / 2,509 | 5,014 / 2,509 |
| Cardholders | 7,055 | 7,055 |
| Total balance | €0.765bn | €0.765bn |
Assumptions / filters: the data is a single snapshot (no time dimension), so KPIs are point-in-time, not trended. The full customer base is analysed — no sampling or row filtering.
5. KPIs & success metrics
Success metrics (monitored against a target):
| KPI | Current | Target | Why it's tracked |
|---|---|---|---|
| Churn rate (primary) | 20.4% | ≤ 15% | North-star: are we keeping customers? |
| Retention rate | 79.6% | ≥ 85% | Inverse view, board-friendly |
| Active-member rate | 51.5% | ≥ 60% | Engagement lever |
| Cross-sell rate (2+ products) | 49.2% | ≥ 60% | Product-fit lever |
Deposits & value KPIs (the business in euros):
| KPI | Value | Note |
|---|---|---|
| Deposits under management | €765M | total deposit book |
| Avg balance / customer | €76.5K | across all 10,000 |
| Stable deposits | €579M | held by retained customers |
| Deposits at risk | €186M | 24% of the book — held by churners |
| Revenue at risk | ≈ €4.6M / yr | of ~€19.1M est. net-interest income (illustrative: 2.5% NIM on deposits; the data has no revenue field) |
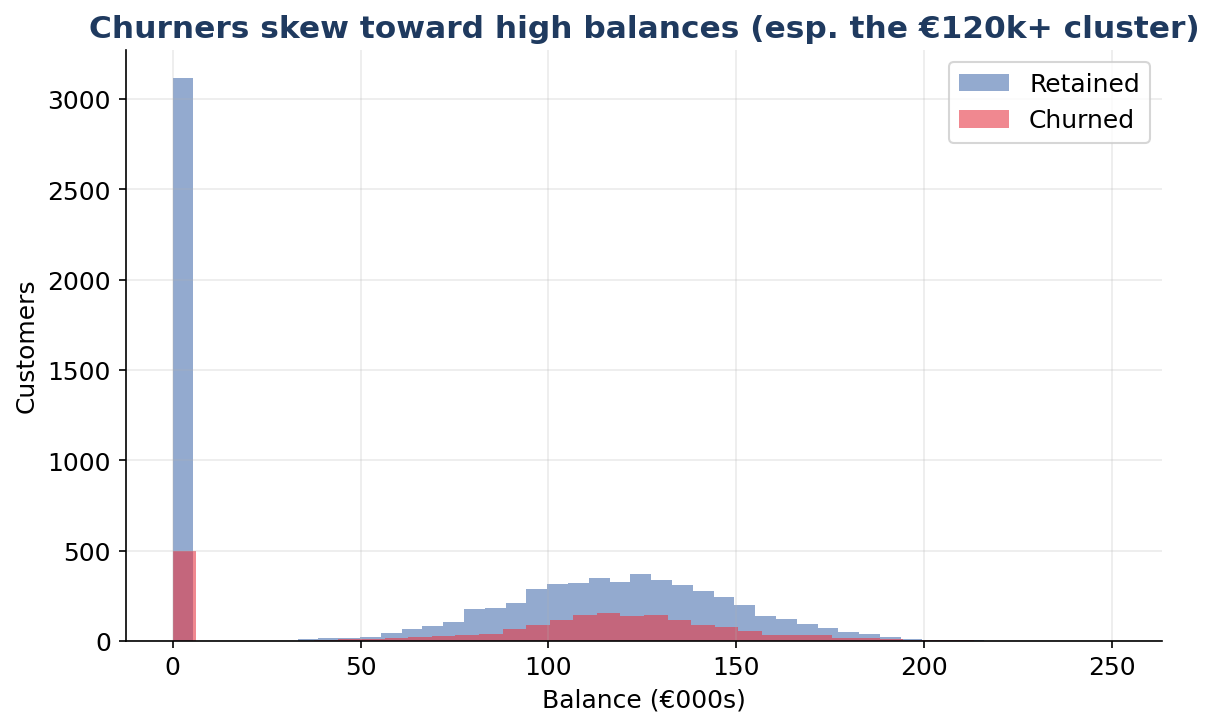
Risk indicators: high-balance churn (>€100k) 25.2% · single-product share 50.8% · inactive customers 4,849.
Rationale: churn rate is the single headline metric; balance- and revenue-at-risk make the business feel it in euros; activity and cross-sell are the levers management can actually pull. Targets are set for the next year.
6. Deep-dive findings
6.1 The product paradox (strongest, most actionable driver)
| Products | Customers | Churn |
|---|---|---|
| 1 | 5,084 | 27.7% |
| 2 | 4,590 | 7.6% ← sweet spot |
| 3 | 266 | 82.7% |
| 4 | 60 | 100.0% |
Two products is the stickiest state. But pushing customers to 3–4 products is associated with near-certain churn — a sign that aggressive cross-selling (or fee-loading) onto already-dissatisfied customers backfires. Meanwhile half the base sits on a single product and churns at 27.7%.
6.2 Germany & the deposit drain
| Country | Customers | Churn | Avg balance |
|---|---|---|---|
| France | 5,014 | 16.2% | low |
| Germany | 2,509 | 32.4% | €119,730 |
| Spain | 2,477 | 16.7% | low |
Germany churns at twice the rate of the other markets and holds ~2× the average balance (€120k vs €62k). German churners alone represent €98M of balance at risk — the bank's biggest and most valuable leak.
6.3 Age & engagement
- Churn climbs steeply with age: 7.5% (18–30) → 12% (31–40) → 34% (41–50) → 56% (51–60) → 25% (60+). Age is the strongest numeric correlate of churn (r = +0.285).
- Inactive members churn at 26.9% vs 14.3% for active (r = −0.156).
- Women churn at 25.1% vs 16.5% for men.
- Actionable overlap: the 2,521 customers who are both inactive and single-product churn at 37%.
6.4 What does not drive churn
| Factor | Evidence | Correlation |
|---|---|---|
| Tenure | flat ~19–21% at every tenure | −0.01 |
| Credit score | 22% (poor) vs 19% (good) — faint | −0.03 |
| Has credit card | 20.8% vs 20.2% — none | −0.01 |
These should not absorb retention budget. Focus where the signal is: products, geography, age, engagement.
7. Recommendations
- Launch a Germany retention task force. Highest churn + highest balances → review pricing, product fit and local service. Biggest single opportunity.
- Fix the multi-product problem. Audit why 3–4-product customers leave (fees? mis-selling? onboarding?) before any further cross-sell to them.
- Move single-product customers to two products. Targeted, value-led second product — 2 products is the 7.6%-churn sweet spot, and this is the largest reachable group (≈5,000 customers).
- Re-activate the inactive. Engagement campaign for the 2,521 inactive single-product customers churning at 37% — the clearest at-risk segment.
- Protect the 45–60 segment. Proactive relationship outreach for older, higher-balance, higher-churn customers (and women, who churn more).
8. Conclusion
One in five customers leave, but the churn is concentrated and addressable. It is a story of product fit, geography, age and engagement — not tenure or credit history. Concentrating retention effort on Germany, multi-product, and inactive single-product customers and moving churn from 20.4% → 15% would retain ~540 more customers per cycle and protect tens of millions of euros in deposits.
Appendix — reproducibility
analysis/1_clean_data.py      → deliverables/bank_churn_clean.csv + cleaning_log.md
analysis/2_eda_analysis.py    → kpis.json, segment_tables.xlsx, charts/*.png
analysis/3_build_dashboard.py → deliverables/dashboard.html  (interactive)
analysis/4_build_deck.py      → deliverables/Bank_Churn_Analysis.pptx
Run in order with python3 analysis/<script>.py from the project root. Requires: pandas, numpy, matplotlib, seaborn, openpyxl, plotly, python-pptx, pillow.